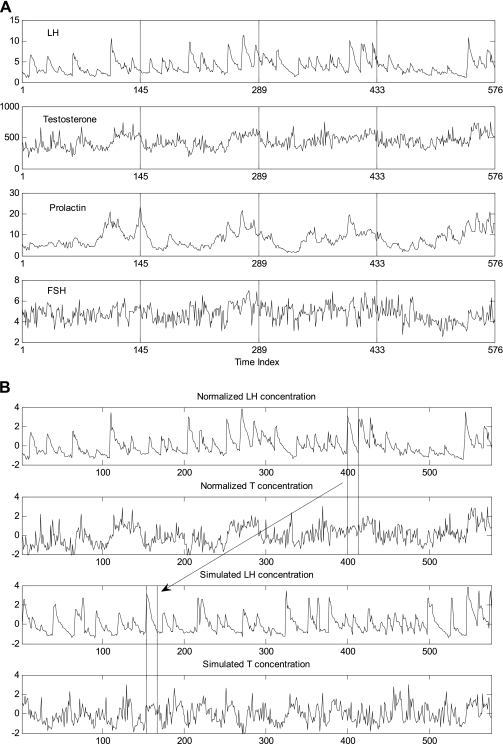
Fig. 1.
A: 4-day (5,760-min, x-grid at 8 AM) record of 10-min LH, testosterone (T), prolactin, and FSH concentrations (top to bottom) in 1 subject (21-yr-old man). B: 4-day, 10-min LH and T paired profiles (top 2 rows) and resampled LH interpulse intervals concomitantly with T (bottom 2 rows). The starting and ending points of 1 LH interpulse interval concomitantly with T are identified by vertical lines. Note the location shift of this piece of 2-dim data. Data are z-score transformations (SDs with zero mean and unit SD).

