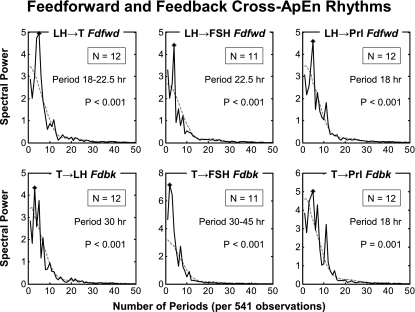
Fig. 4.
Mean periodograms (over n periodograms, where n is the number of men) of LH-T, LH-FSH, and LH-prolactin feedforward synchrony and T-LH, T-FSH, and T-prolactin feedback synchrony. Periodograms determined in healthy men of cross-ApEn using the original (unshuffled) time series (solid curve) and the 95% limit for shuffled (randomly resampled 1,000 times for each man) time series (dashed curve). The length of primary periodicity is given in hours, and the P value is estimated from the cumulative frequency distribution of the 1,000 randomly generated mean periodogram amplitudes (methods).

