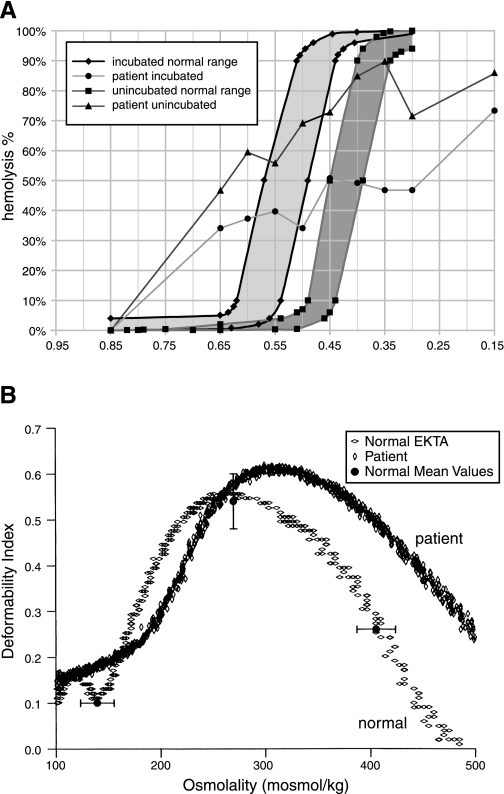
Fig. 2.
Fragility of stomatocytosis red cell membrane. A: osmotic lysis curves. X-axis values represent relative tonicity. Normal range of control red cells unincubated (▪) or after 24-h incubation as heparinized whole blood at 37°C (♦). Patient 1 red cells unincubated (▴) or after 24 h incubation (•). B: osmotic deformability curves measured by ektacytometry (EKTA) for red cells from patient 1 (vertical ◊) compared with a normal control (horizontal ◊). Normal mean values for three values of osmotic strength are portrayed as filled circles ± SD. Omin was 177 (normal range 140 ± 16.0); Dimax was 0.62 (normal range 0.54 ± 0.06); Ohyp was 482 (normal range 406 ± 18.3). Terms are described in methods.

