Fig. 1.
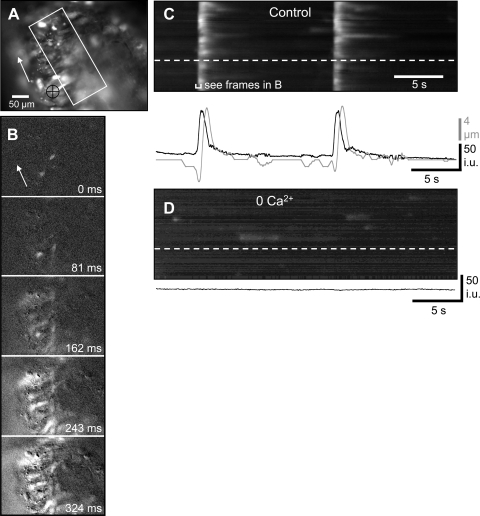
Effects of low extracellular Ca2+ concentration ([Ca2+]o) on Ca2+ waves within the myosalpinx. A: an oviduct loaded with the Ca2+ indicator dye Fluo-4 arranged with the ovarian pole uppermost. The area in which a spatiotemporal map (STMap) was constructed is marked by the white rectangle. Tissue movement was tracked in the region underneath the black crosshairs. The white arrow shows the direction of Ca2+ wave propagation along the oviduct. B: image sequence showing the longitudinal spread of a Ca2+ wave along the oviduct from the uterine pole toward ovarian pole as indicated by the white arrow. Frames show differentiated Ca2+ fluorescence (Δt = 162 ms). C: STMap of the rhythmically occurring Ca2+ waves during a 30-s recording period. The white streaks represent Ca2+ waves that propagate from the bottom to the top of the field of view. The change in Ca2+ fluorescence in one region of the oviduct (denoted by the white dashed line) is shown in the black trace below the STMap. Oviduct contractions are shown in the gray trace. D: upon removal of [Ca2+]o, Ca2+ waves were reduced/abolished, but intracellular Ca2+ transients in isolated cells could still be detected (spots in 0 mM [Ca2+]o STMap). The black trace underneath the STMap calculated from a region shown by the white dashed line in the STMap shows the absence of Ca2+ waves after 0 mM [Ca2+]o.

