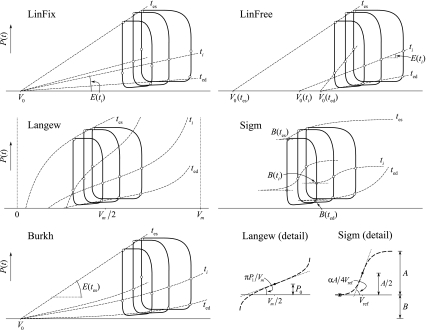
Figure 1.
The isochrone models compared in this study with the meaning of their parameters. PV-loops representing three different preload-conditions are shown. Open circles denote corresponding (isochronal) points in the cardiac cycles. An isochrone (dashed line) is shown for each of the four cardiac phases. The dots within the open circles in the Sigm model denote the pressure of the loop at the lowest filling pressure to which parameter B is set. For clarity, the loops in the Langew and Sigm model are shifted along the volume axis. Shroff is not shown, since it is the same as the LinFix model apart from ejection where its isochrones, due to flow dependence, do not have such a clearly prescribed shape as the other models have. See text for abbreviations and details

