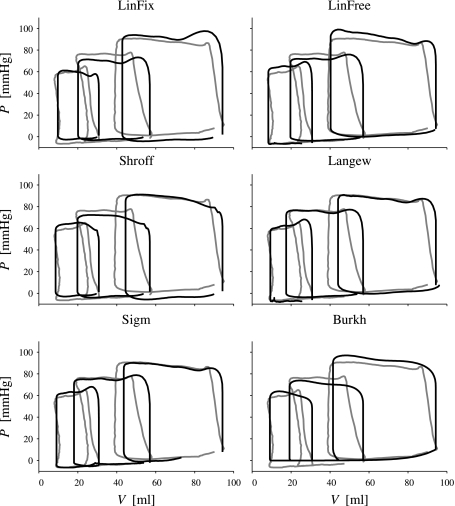
Figure 6.
Examples of three simulated (thick lines) and measured (gray lines) PV-loops. Loops at the highest, middle and lowest filling pressure are shown for each model. Since end-diastolic volume in the simulation model was fixed to the measured value, the simulated loops start at the same volume as the measured loops. Note that in the high preload loop of the sigmoid model, the source resistance was too large resulting in incomplete filling

