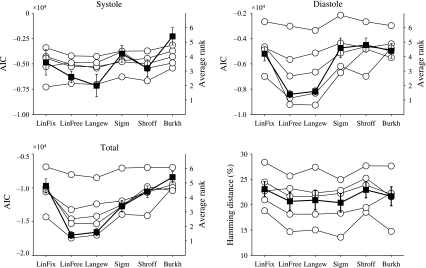
Figure 8.
Upper left: Akaike’s information criterion (AIC) score of each sheep for each model during systole. The score is based on the sum of squared residuals and the number of parameters in the model (Eqs. 10 and 11). The model with the lowest score is the most likely model for the given data. Since AIC values are only comparable within a data set (i.e., within the data of individual sheep), the average ranks (right axis) are shown as black squares (mean ± SEM). Upper right: AIC scores for diastole. Lower left: AIC scores for the complete cardiac cycle. Lower right: Hamming distance between measured and simulated PV-loops for each sheep. A zero Hamming distance means that the shapes are identical. Black squares denote mean ± SEM

