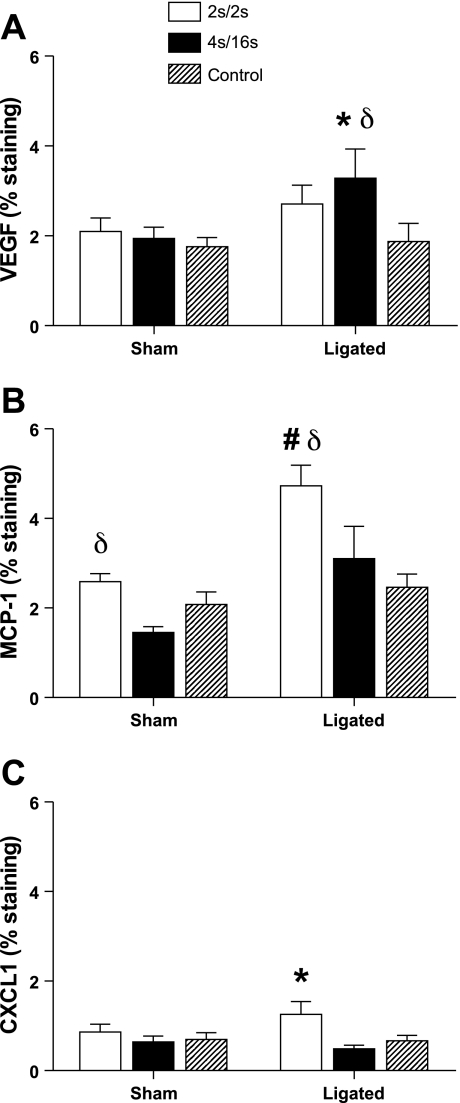
Fig. 4.
Immunohistochemistry quantification in cross sections of the rat TA muscle harvested 150 min following the completion of a single session of IPC. % Staining is percent of slide area positive for staining. A: VEGF. B: MCP-1. C: CXCL1. Values are expressed as means ± SE; n = 4 in each treatment. #P < 0.01 and *0.01≤ P ≤ 0.05 vs. control group. δ0.01 ≤ P ≤ 0.05 vs. corresponding treatment in the sham animals.

