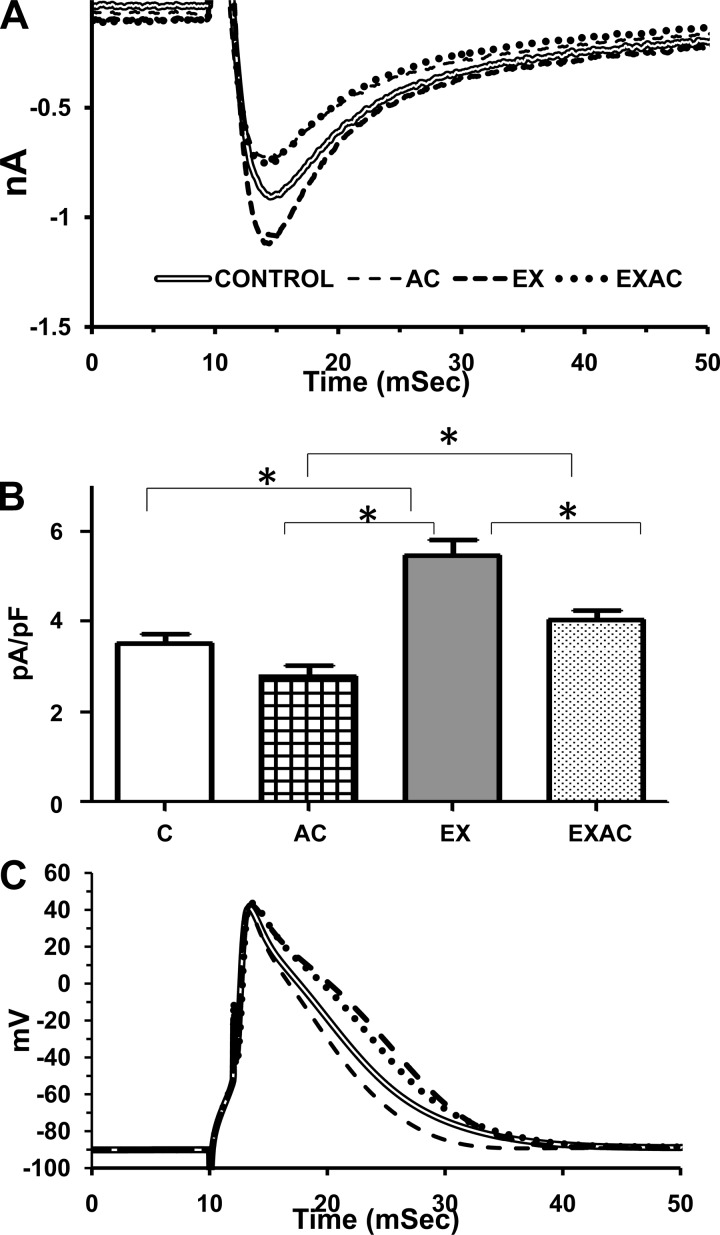
Fig. 3.
A: averaged lines of L-type Ca2+ currents. B: current density amplitude. C: averaged lines of action potential of cardiomyocytes. *Significance vs. control P < 0.05, 1-way ANOVA. Action potential duration in milliseconds at 70 and 30% of the amplitude height are: 70%: control, 5.6 ± 0.5; AC, 4.6 ± 0.2;* EX, 7.4 ± 0.3;* EXAC, 6.0 ± 0.5. 30%: control, 12.5 ± 0.85; AC, 10.4 ± 0.6;* EX, 15.1 ± 0.4;* EXAC, 13.0 ± 0.7. *Significance vs. control P < 0.05, 1-way ANOVA.

