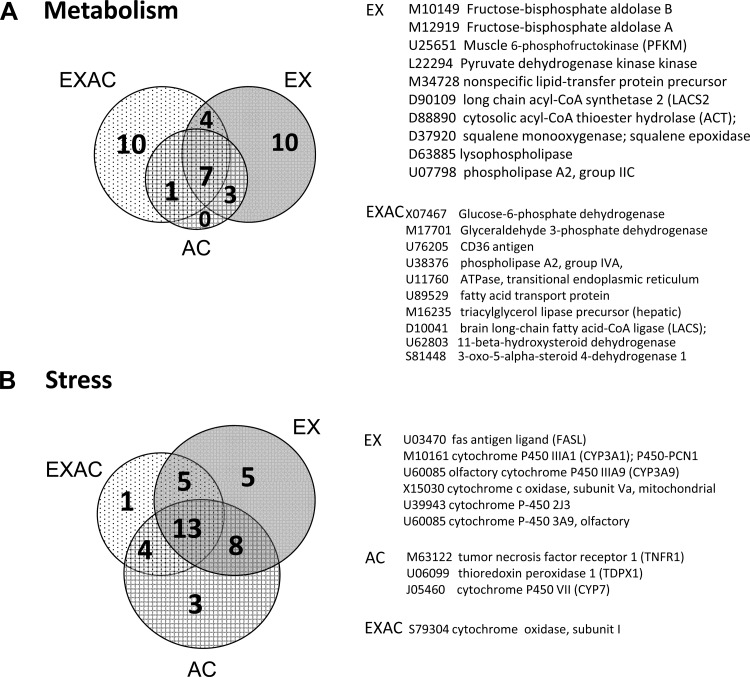
Fig. 6.
Venn diagram of stress-specific responding genes associated with energy metabolism (A) and stress/cytoprotection (B). Genes that were impacted uniquely by 1 component of the stress are marked (EXAC, EX, or AC). For sorting of stress specific genes see legend to Fig. 5.

