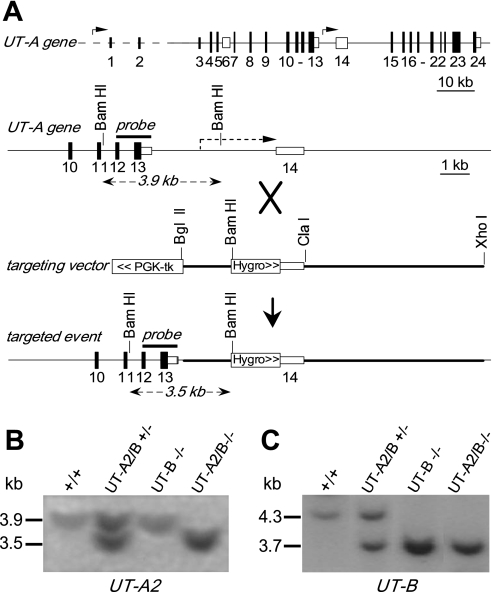
Fig. 1.
Gene targeting strategy for urea transporter UT-A2 knockout. A, top: organization and restriction map of the mouse UT-A gene. Rectangles indicate exon segments with coding regions shaded; middle: targeting strategy for UT-A2 gene promoter deletion. Homologous recombination results in replacement of the indicated segments (thick line) of the UT-A gene. PGK-tk and a hygromycin selectable marker were engineered (boxed); bottom: UT-A gene structure after gene targeting. Probe used for Southern blot analysis is indicated (“probe”) along with expected sizes of hybridized fragments after BamHI digestion. B: Southern blot of genomic DNA from liver of different genotypes as indicated (+/+, wild-type; UT-A2/B +/−, UT-A2/B knockout heterozygotes; UT-A2/B −/−, UT-A2/B knockout homozygotes; UT-B −/−, UT-B knockout homozygotes) digested with BamHI and probed as indicated. B and C: Southern blot of the same genomic DNA digested with SpeI and probed by a UT-B gene fragment as indicated (29).

