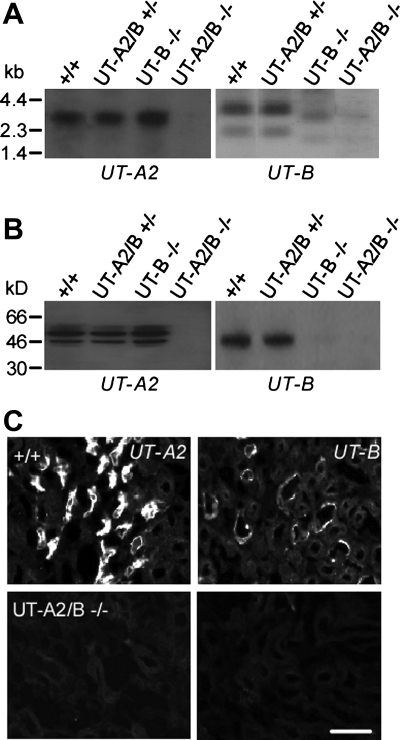
Fig. 2.
UT-A2 and UT-B expression in kidney. A: Northern blot of kidney from indicated genotypes probed with the mouse UT-A2 or UT-B coding sequence. B: immunoblot analysis using purified polyclonal UT-A2 or UT-B antibody. C: UT-A2 and UT-B immunofluorescence of kidney outer medulla stained by polyclonal UT-A2 or UT-B antibody. Scale bar = 50 μm.

