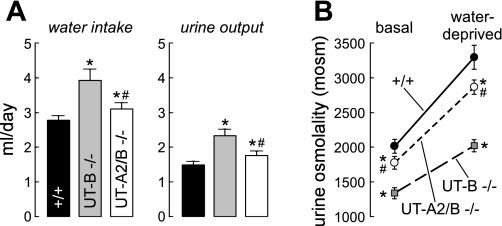
Fig. 3.
Urinary concentrating function. A: 24-h fluid consumption (left) and urine output (right) in mice of indicated genotype. B: urine osmolality (Uosm) measured in mice given free access to food and water (basal) and after an 18-h water deprivation. Data for 6 individual mice/group are shown together with means ± SE. *P < 0.01 compared with wild-type mice. #P < 0.01 compared with UT-B knockout mice.

