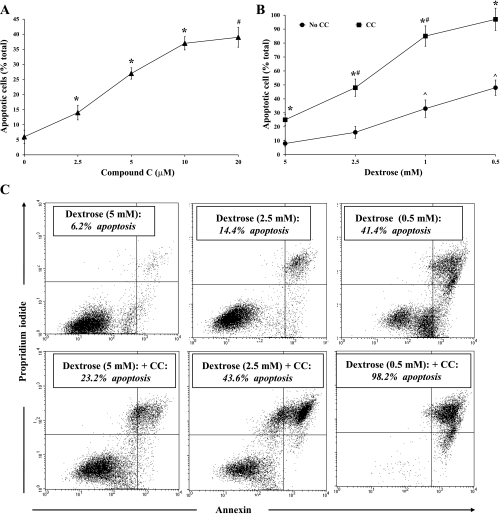
Fig. 3.
Inhibition of AMPK by CC induces apoptosis of BU.MPT cells treated with antimycin A. A: varying concentrations of CC were added to BU.MPT cells incubated in reduced dextrose (2.5 mM) and antimycin A (2 μM) for 16–18 h. Apoptosis was quantified by flow cytometry. *P < 0.01, each CC concentration vs. preceding CC concentration. #P < 0.01, 20 μM CC vs. 5 μM CC. B: BU.MPT cells were exposed to antimycin A (2 μM) in the presence of varying concentrations of dextrose in either the presence (■) or the absence (●) of CC (20 μM). *P < 0.001, presence vs. absence of CC at each concentrations of dextrose. #P < 0.01, each dextrose concentration vs. preceding dextrose concentration for cells incubated in the presence of CC. ^P < 0.02, 0.5 and 1.0 mM dextrose vs. 2.5 and 5.0 mM dextrose in the absence of CC. C: representative flow cytometric analysis of BU.MPT cells incubated in the presence of antimycin A and varying concentrations of dextrose, in either the absence (top) or the presence (bottom) of CC (20 μM). Apoptosis was quantified following staining with annexin V (x-axis) and PI (y-axis). For each condition, the percentage of apoptotic cells was obtained by summing the percentages of early apoptotic (annexin V-positive, PI-negative) and late apoptotic (annexin V-positive, PI-positive) cells.

