Fig. 5.
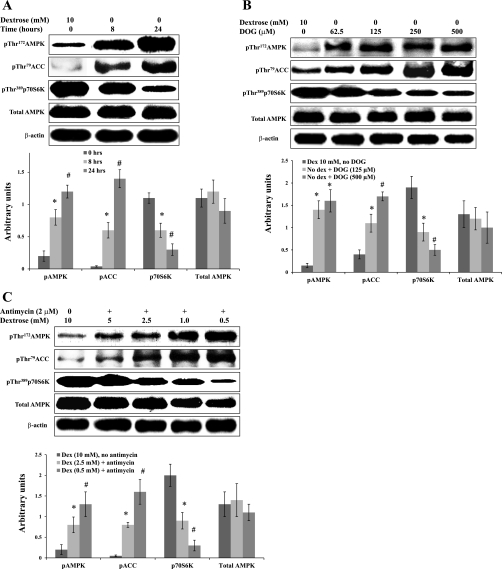
Metabolic stress activates the AMPK signaling pathway. A: BU.MPT cells were incubated in dextrose-containing (10 mM) or dextrose-free medium for 8 or 24 h. Top: representative immunoblot. Bottom: results of 3 experiments by densitometric analysis using β-actin as a loading control. *P < 0.05, vs. dextrose control at 8 h. #P < 0.05, vs. dextrose control at 24 h. B: BU.MPT cells were incubated for 6 h in either medium containing 10 mM dextrose (control cells) without DOG or in dextrose-free medium with varying concentrations of DOG. Top: representative immunoblot. Bottom: results of 3 experiments by densitometric analysis using β-actin as a loading control. *P < 0.05, vs. dextrose, no DOG control. #P < 0.05, vs. no dextrose+DOG (125 μM). C: BU.MPT cells were incubated for 6 h in either dextrose-containing (10 mM) medium in the absence of antimycin A (control cells) or in medium containing varying concentrations of dextrose plus antimycin A (2 μM). Top: representative immunoblot. Bottom: results of 3 experiments by densitometric analysis using β-actin as a loading control. For all experiments, cell lysates were probed with antibodies against phosphorylated (active) AMPK, phosphorylated (inactive) ACC, phosphorylated (active) p70S6K, total AMPK, and total β-actin. *P < 0.05, vs. dextrose, no antimycin. #P < 0.05, vs. dextrose (2.5 mM)+antimycin.

