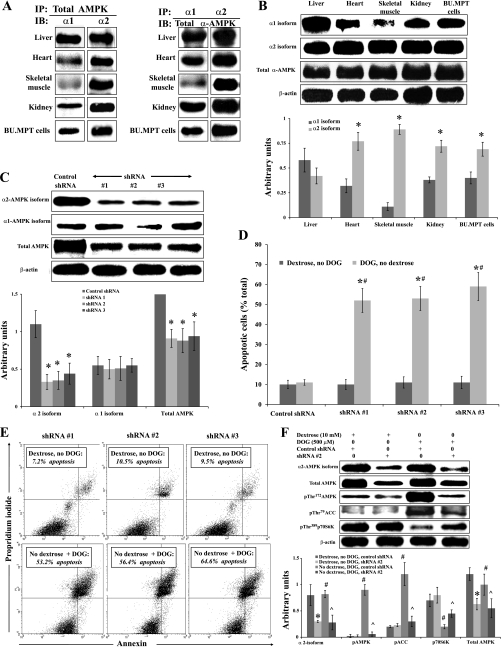
Fig. 7.
Inhibition of AMPK by gene silencing with short hairpin (sh) RNA induces apoptosis and prevents metabolic stress-induced signaling events in BU.MPT cells subjected to acute metabolic stress. A: whole organ lysates of mouse liver, heart, skeletal muscle, and kidney and lysates of cultured BU.MPT cells were obtained, and the relative expression of the α1- and α2-isoforms of AMPK was determined by immunoprecipitation (IP) followed by immunoblotting (IB). Left: IP was performed using an antibody to total AMPK followed by IB with antibodies to the α1- and α2-isoforms of AMPK (n = 4). Right: IP was performed using antibodies to either the α1- or the α2-isoform of AMPK followed by IB using an antibody to the total catalytic domain (i.e., total α-AMPK; n = 3). B: whole organ lysates of mouse liver, heart, skeletal muscle, and kidney and lysates of cultured BU.MPT cells were probed with antibodies to the α1- and α2-isoforms of the catalytic domain of AMPK and to the total catalytic domain (total α-AMPK). Top: representative immunoblot. Bottom: results of 4 experiments by densitometric analysis using β-actin as a loading control. *P < 0.01, vs. α1-isoform in the corresponding tissue. C: BU.MPT cells were infected with vectors expressing either a nontargeting shRNA or 1 of 3 distinct shRNAs (denoted shRNA #1, #2, and #3) designed to knock down expression of the α2-isoform of AMPK. Lysates from unstressed BU.MPT cells (incubated in 10 mM dextrose) were probed with antibodies specific for the α1- and α2-isoforms of AMPK, total AMPK, or total β-actin. Top: representative immunoblot. Bottom: results of 3 experiments by densitometric analysis using β-actin as a loading control. *P < 0.05, vs. control shRNA for the same antibody. D: BU.MPT cells, infected with control shRNA or 1 of the 3 shRNAs targeted to α2, were incubated in dextrose-containing medium (10 mM) without DOG (dark gray bars) or in dextrose-free medium plus DOG (500 μM; light gray bars). After 16–18 h, apoptosis was assessed by flow cytometry. *P < 0.001, presence vs. absence of DOG for each targeted shRNA. #P < 0.001, targeted vs. control shRNA in the presence of DOG. E: representative flow cytometric analysis of BU.MPT cells infected with each of 3 shRNAs targeted to the α2-isoform of AMPK and incubated in either dextrose-containing medium (10 mM) without DOG (top) or in dextrose-free medium with DOG (500 μM; bottom). Apoptosis was quantified following staining with annexin V (x-axis) and PI (y-axis). For each condition, the percentage of apoptotic cells was obtained by summing the percentages of early apoptotic (annexin V-positive, PI-negative) and late apoptotic (annexin V-positive, PI-positive) cells. F, top: BUMPT cells were infected with either control shRNA or shRNA #2, specific for the α2-isoform of AMPK, and either cultured under control conditions (10 mM dextrose) or subjected to metabolic stress for 6 h [no dextrose+DOG (500 μM)]. Cell lysates were probed with antibodies against the α2-isoform of the catalytic domain, total AMPK, phosphorylated (active) AMPK, phosphorylated (inactive) ACC, phosphorylated (active) p70S6K, and total β-actin. A representative immunoblot is shown. Bottom: results of 3 experiments by densitometric analysis using β-actin as a loading control. *P < 0.05, vs. dextrose, no DOG, control shRNA. #P < 0.05, vs. dextrose, no DOG, shRNA #2. ^P < 0.05, vs. no dextrose, DOG, control shRNA.

