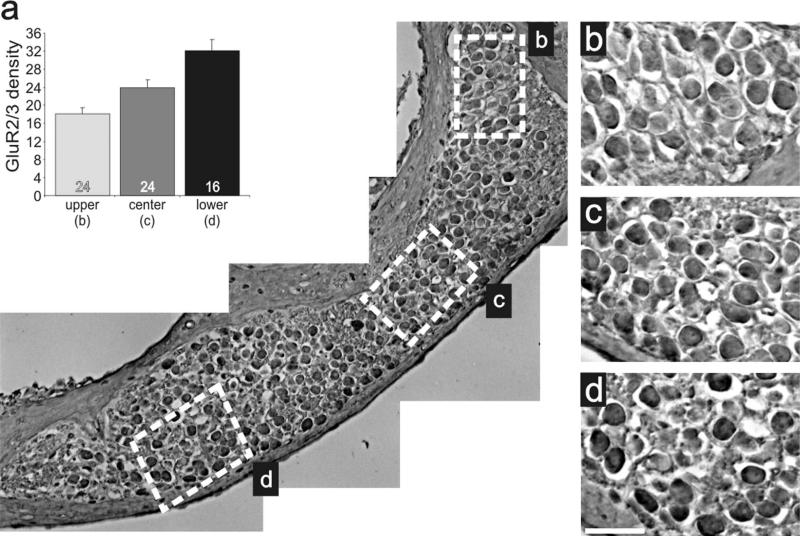
Figure 11.
Anti-GluR2/3 antibody labeling was graded within a localized cochlear region. a: Low-magnification image of adult inner ear tissue labeled with anti-GluR2/3 (brown) antibody sectioned to include an elongated region of neurons that spanned the cochlear contour. Average anti-GluR2/3 antibody density levels measured from neurons within the upper (b, n = 24), center (c, n = 24), and lower (d, n = 16) white boxes. b–d. High-magnification images of neurons demarked by white boxes in a showing the subtle increase in anti-GluR2/3 antibody staining intensity in more basal neurons compared with apical ones within a single cochlear turn. The upper region is apical with respect to the lower region. Scale bar = 25 μm in d (applies to b–d).

