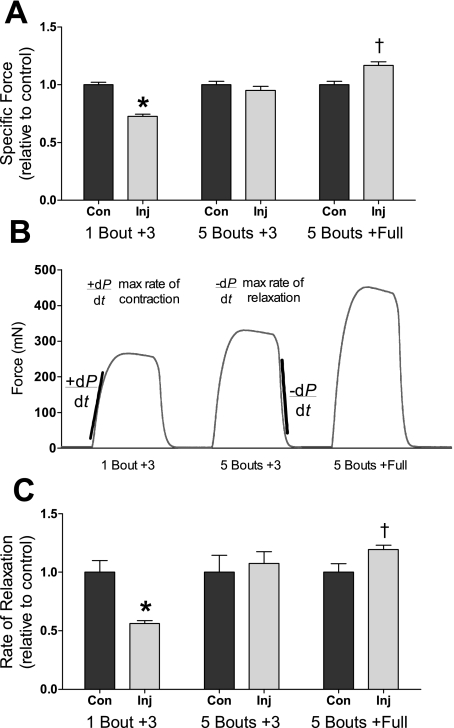
Fig. 4.
Ex vivo contractility of EDL muscles. A: injured (Inj) EDL muscle peak specific force for 1 bout +3, 5 bouts +3, and 5 bouts +full mice relative to contralateral control (Con) EDL muscles. B: representative isometric force tracings (force vs. time) for the three experimental groups. The maximal rate of contraction (+dP/dt) was determined from the greatest slope during a maximal isometric tetanic contraction. The maximal rate of relaxation (−dP/dt) was determined from the greatest slope during relaxation from a maximal isometric tetanic contraction. C: tetanic rate of relaxation in injured EDL muscles relative to contralateral control muscles. *P ≤ 0.019, less than the contralateral control muscle; †P ≤ 0.049, greater than the contralateral control muscle.

