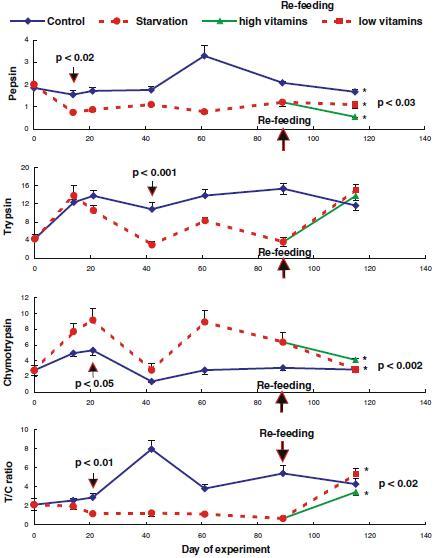
Figure 2.

Effect of starvation on expressions of pepsin, trypsin, and chymotrypsin in the digestive tract of Atlantic salmon. Arrows with probability values indicate first observations of significantly changing in the enzyme expressions. The values with asterisk (*) are significantly different (p<0.05). The enzyme specific activities are expressed as µmol tyrosine h−1 mg protein−1 for pepsin in the stomach, and as µmol p-nitroaniline h−1 mg protein−1 for trypsin and chymotrypsin in the pyloric caeca.
