
Figure 14.
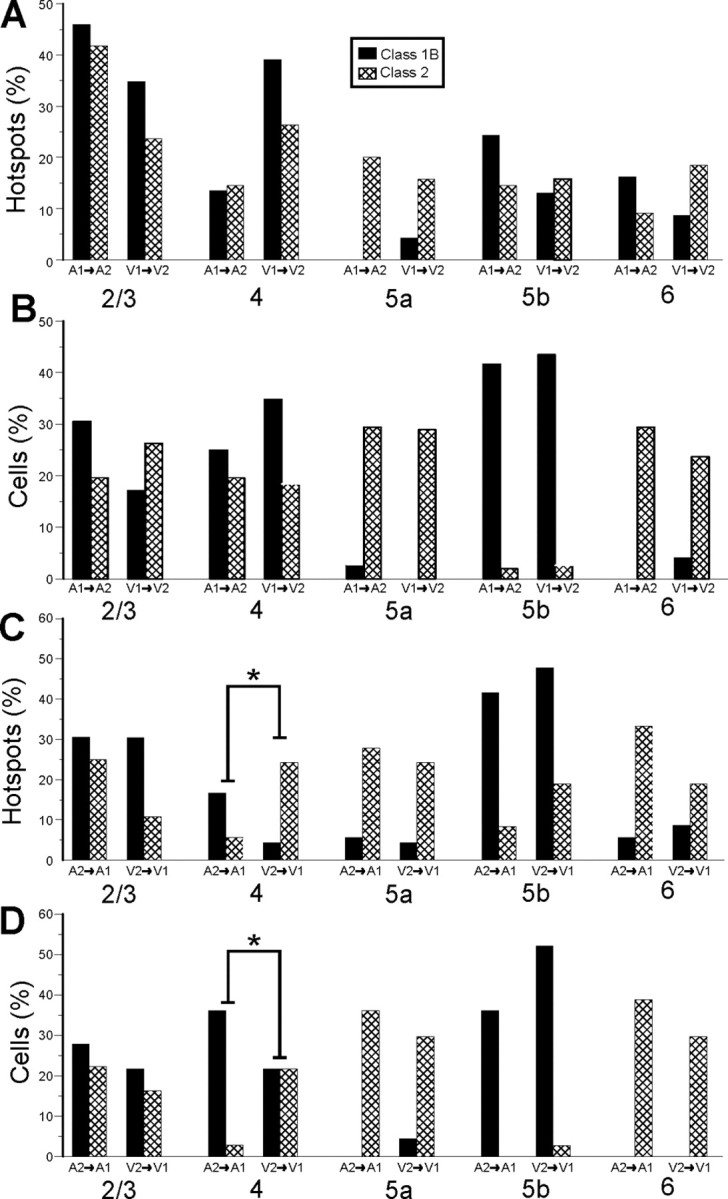
Comparison of laminar relationships between auditory and visual pathways. Data for the auditory pathways (A1-to-A2v and A2v-to-A1) for this figure and Figure 15 are taken from Covic and Sherman (2011). A, Comparison between A1-to-A2v and V1-to-V2 pathways for laminar normalized distribution of footprints. B, Comparison between A1-to-A2v and V1-to-V2 pathways for laminar normalized distribution of recorded cells. C, Comparison between A2v-to-A1 and V2-to-V1 pathways for the laminar distribution of footprints. D, Comparison between A2v-to-A1 and V2-to-V1 pathways for laminar location of recorded cells. *p < 0.05.