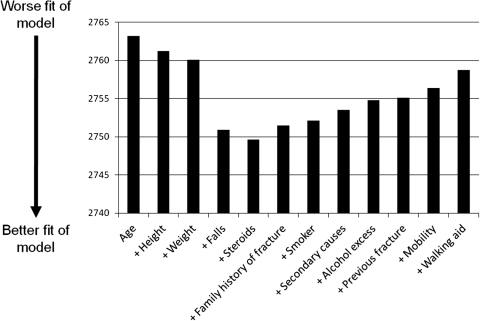
Figure 1.
A scree plot to show which clinical risk factors are the most important in determining fracture risk in this cohort. The plot shows change in goodness of fit with each additional clinical risk factor. Goodness of fit of the models is shown on the y-axis by AIC values where lower levels indicate better fit. The x-axis shows the clinical risk factors included in the models. The simplest model just contains age. All other clinical risk factors were added in a stepwise fashion such that the last model on the right-hand side contains all risk factors.

