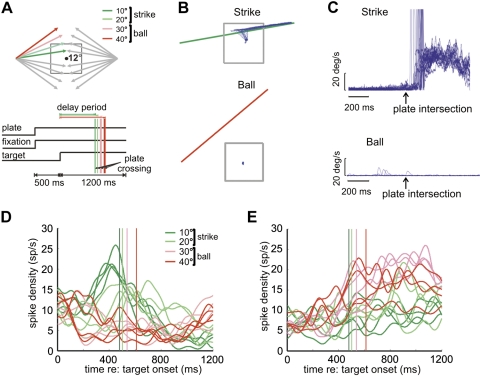
Fig. 1.
Standard ocular baseball. A: task schematics. Top: spatial layout, showing 16 possible target trajectories in relation to the visible 12° plate on the screen. The dot at the center is the fixation spot. Trajectory angles are 10°, 20°, 30°, and 40° with respect to the horizontal meridian. Four trajectories are color coded to illustrate strike (green) and ball (red) trajectories. In each trial, a target appeared at 20° left or right in the periphery and moved inward at 30°/s. Bottom: the temporal events for each trial. The vertical lines show plate intersection times for trials with different angles of horizontal deviation. B: Cartesian eye position from a single block of strike and ball trials. C: radial eye velocity for the same block of trials. D: mean spike rate for a strike neuron in strike (green) and ball (red) trials. The vertical lines indicate corresponding plate intersection times. E: mean spike rate for a ball neuron.

