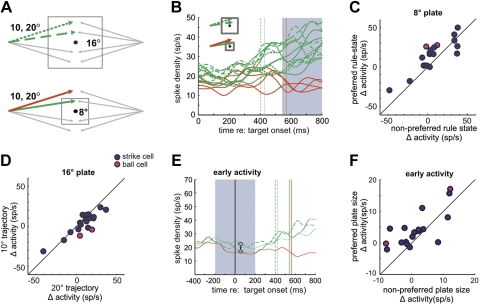
Fig. 5.
Results of 2-plate, 2-trajectory (2P2T) task. A: spatial schematic. Plate size was either 16° (top) or 8° (bottom), and target trajectories were 10° or 20°, all randomized within a block. B: activity of a typical neuron in the 2P2T experiment. Average activity for each trajectory is shown for the large plate (dashed green traces, 10° trajectory; dotted, 20°) and for the small plate (solid green traces, 10°; solid red, 20°). Gray shaded region indicates the analysis period (550–800 ms). The cells were initially classified as baseball related based on delay period activity in standard baseball. A late analysis period is used here because many cells signaled plate size before the target appeared, possibly contaminating the earlier part of delay period. C: summary data for the small plate. Each point represents activity for a single neuron in 2P2T for the trajectories that conformed to its preferred and nonpreferred rule states as determined by their activity in standard ocular baseball. Note higher activity for most cells when the trajectory conformed to the preferred rule state, indicating that neurons were discriminating the different rule states. D: summary data for the large plate. Here the x-axis shows normalized activity for the 10° trajectory and the y-axis for the 20° trajectory. Note that overall there was no significant difference in activity for the 2 trajectories, indicating that neurons classified them as conforming to the same rule state. E: activity of a strike cell averaged over combinations of same angle and plate size from a block of trials showing putative probabilistic encoding of the rule. Green traces are strike trials with the small plate (solid) and large plate, 10° (dashed) and 20° (dotted). The red trace represents the small-plate ball trials. Vertical lines represent plate intersection and are color coded correspondingly. Note that this neuron first responds more for the large plate (top circled traces) than the small plate (bottom circled traces) but later in the trial signals strike and ball. Shaded region shows the analysis period (±200 ms relative to target onset). F: summary data of early activity for all recorded SEF neurons. Activity for the preferred plate size is plotted against that observed for the nonpreferred plate size for both strike and ball neurons. Note that most cells signaled plate size. The difference in activity, Δ activity, for the preferred plate size refers to the spike rate for large-plate trials minus that for small-plate trials for strike neurons and the small-plate spike rate minus the large-plate spike rate for ball neurons.

