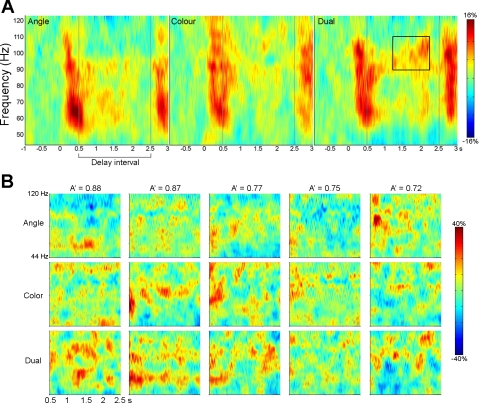
Fig. 3.
A: time-frequency spectrograms for virtual sensors placed in the peak location of increased 80–100 Hz left parietal gamma source power in each task. Virtual sensors were obtained by identifying the location of peak activity in each individual subject/condition that was closest to the location of peak activity in the group analysis. Vertical lines indicate the beginning and end of the delay interval. B: time-frequency spectrograms showing the delay interval activity in each task for a sample of 5 individual participants with dual-task A′ scores ranging from high (on left) to low (on right).

