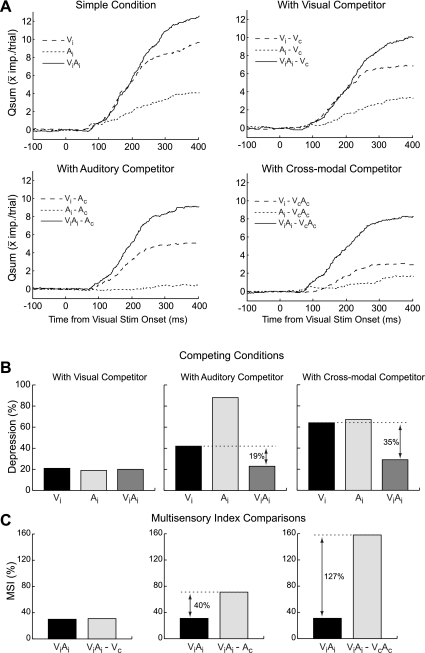
Fig. 3.
The effect of competitive stimulus interactions on the temporal profile of responsiveness in an example neuron. A: the cumulative number of stimulus-driven impulses (Qsum) in the simple and competing stimulus conditions. In the simple conditions, the largest unisensory response (visual) had a temporal profile similar to the multisensory response for 200 ms after stimulus onset. B: however, in the presence of an auditory or cross-modal competitor, the visual response was depressed more than the multisensory response. C: this differential depression is evident in the early and later phases of the visual response, resulting in a notable increase in the MSI. Conventions are the same as in Fig. 2.

