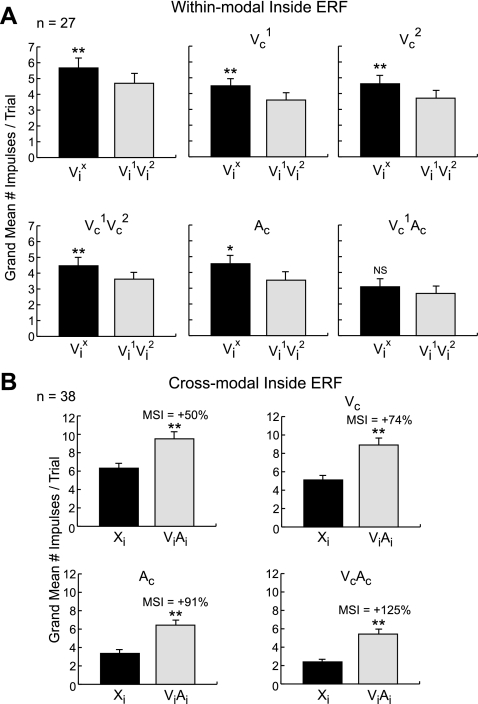
Fig. 9.
The differential effect of competitive stimulus interactions on unisensory and multisensory integration. A: bar graphs compare the mean of the largest modality-specific visual responses (Vix) to the mean of the within-modal visual responses (Vi1Vi2). The within-modal visual response was significantly smaller than the largest visual response, and competing stimuli had little effect on this relationship. B: however, competing stimuli increased the percent difference between the multisensory response and the largest unisensory response (Xi). Conventions are the same as in previous figures.

