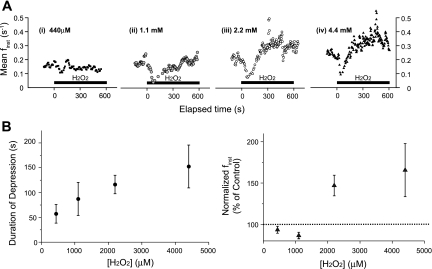
Fig. 4.
Dose response of H2O2 on the frequency of rhythmogenesis from the preBötC. A: representative plots of the running average of finst as a function of time when exposed to 440 μM (i), 1.1 mM (ii), 2.2 mM (iii), or 4.4 mM (iv) H2O2. Using the plots of the running average of finst revealed that H2O2 caused an initial transient concentration-dependent suppression in population activity from the preBötC. B, left: plotting the duration of the suppressed finst as a function concentration revealed the H2O2-mediated transient suppression of finst at 440 μM (n = 4/6), 1.1 mM (n = 3/5), 2.2 mM (n = 17/20), and 4.4 mM (n = 6/6) H2O2. Right: plotting the mean normalized finst values for the experiments showing an transient suppression of finst illustrates the biphasic nature of the frequency response of rhythmogenesis to H2O2 and the ability of H2O2 to augment frequency at the highest concentrations tested.

