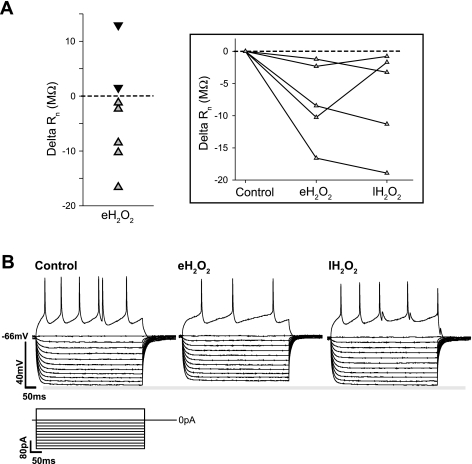
Fig. 6.
Effect of H2O2 on individual preBötC neurons. A: although exposure to H2O2 (2.2 mM, 600 s) did not have a significantly measurable effect on the mean input resistance (Rn) of network isolated preBötC neurons (n = 7), during early exposure to H2O2 (eH2O2, t = 60–180 s of exposure) 5 of 7 neurons exhibited a decrease in Rn (gray symbols) while 2 of 7 showed an increase in Rn (black symbols). Inset: plot of the delta Rn of the 5 neurons showing a decrease in Rn during eH2O2 and their delta Rn during the last 120 s of H2O2 exposure (lH2O2). B: representative trace of an individual neuron using the step protocol to determine Rn and relative changes in excitability. In this example a decreased Rn occurs during eH2O2 that rebounds during lH2O2. This change in Rn is accompanied by an initial drop in excitability that rebounds during lH2O2 as determined by the number of evoked action potentials during each phase. The decrease in evoked excitability during eH2O2 was observed in 5 of 7 neurons; 4 of these 5 neurons exhibited a rebound in lH2O2.

