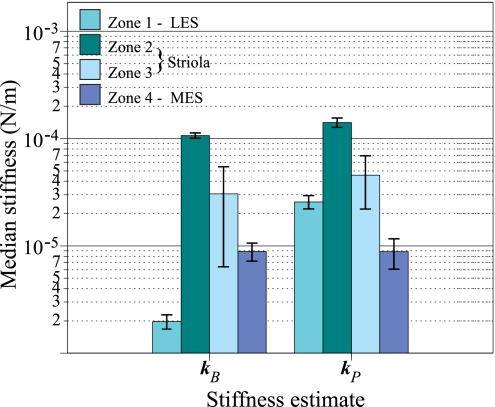
Fig. 5.
Differences in stiffness of hair bundles from 4 macular zones. This grouped bar plot shows zonal differences in hair bundle stiffness. Each group of 4 bars shows bundle stiffness determined by a different method: measured stiffness (kB) and physiological stiffness (kP). Within each group, zones are represented by different colors (see key). Bar heights are medians; error bars are confidence intervals of the median. Medians are plotted on a log axis to expand values at the low end of the stiffness scale. Both methods of determining bundle stiffness give comparable results except that the MES bundles are stiffer than those in the LES when measured values (kB) are used, but their relative stiffnesses are reversed when physiological measures (kP) are used because this method reduces the effects of the very long kinocilia in the LES (Fig. 1B). These bar graphs summarize the individual data points shown in Fig. 4.

