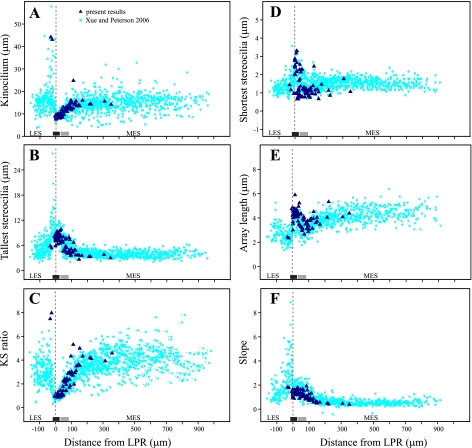
Fig. 7.
Structure of tested hair bundles: variation in 6 structural features (dark blue triangles) as a function of distance from the LPR for the 73 hair bundles evaluated in this study. Corresponding measurements from a study of fixed but not dehydrated utricular bundles (Xue and Peterson 2006) are shown with light blue circles for comparison. Dimensions from the 2 data sets are very similar. A partial exception is that array length is longer in the present study (and therefore Slopes are shallower) because we included the kinocilium in our measure of array length, whereas Xue and Peterson (2006) did not. A: kinocilium height. B: height of tallest stereocilia. C: KS ratio. D: height of shortest stereocilia. E: array length. F: Slope. Bars above the x-axis show the approximate location of zone 2 (black bar) and zone 3 (gray bar).

