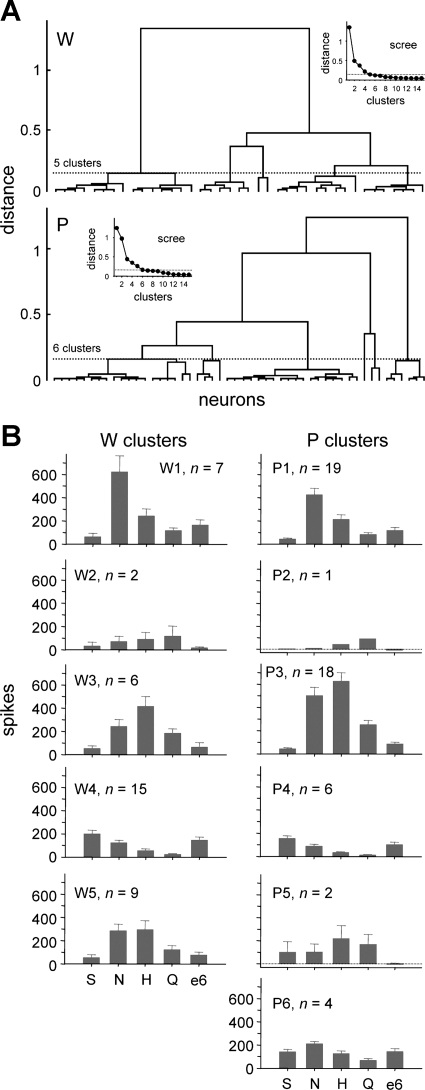
Fig. 2.
A: dendrograms representing the outcome of hierarchical cluster analyses used to define general trends in responding to prototype stimuli (group I, Table 1) among neurons sampled from Wistar (W) and ethanol-preferring P rats. Insets: scree plots used to “cut” tuning clusters from each tree. B: mean + SE responses to 0.5 M sucrose (S), 0.1 M NaCl (N), 0.01 M HCl (H), 0.01 M quinine (Q), and 40% ethanol (e6) observed in the 5 W and 6 P neural clusters identified in A. The number of neurons in each cluster is given.

