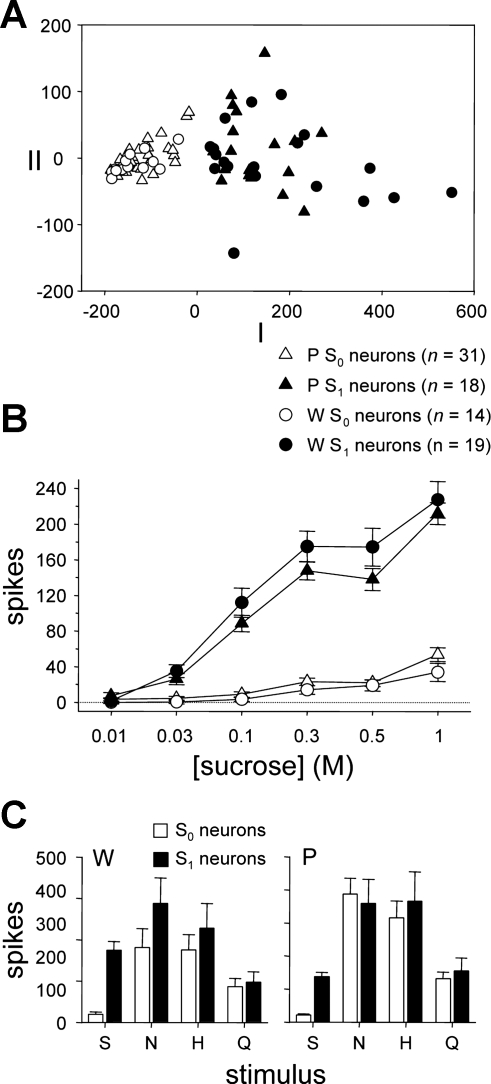
Fig. 3.
A: outcome of multidimensional scaling (MDS) of neurons recorded from W (circles) and ethanol-preferring P rats (triangles) according to their responses to 0.01, 0.03, 0.1, 0.3, 0.5, and 1 M sucrose. The first 2 dimensions of 3-dimensional metric MDS applied to a matrix of Euclidean distances between neurons are shown. Open symbols denote neurons showing low sensitivity to the sucrose series (S0 cells), and filled symbols indicate neurons with high sensitivity to sucrose (S1 cells), as identified by k-means clustering. The number of neurons in each category is indicated. MDS and k-means gave similar partitions of cells. B: mean ± SE responses to the sucrose series by S0 and S1 neurons recorded from W and P rats. Key is shared with A. C: mean + SE responses to prototype stimuli (group I, Table 1) by S0 and S1 neurons recorded from W and P rats.

