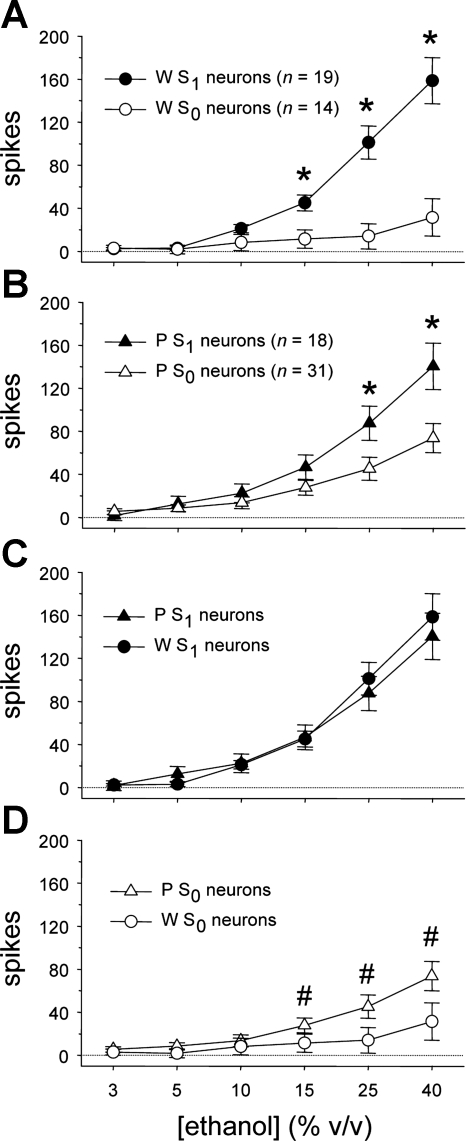
Fig. 4.
A: mean ± SE responses to the ethanol concentration series by neurons with low (S0) and high (S1) sensitivity to sucrose recorded from Wistar (W) rats. *Simple effect of neural sucrose sensitivity on ethanol activity (P < 0.05). B: mean ± SE responses to ethanol by S0 and S1 neurons in ethanol-preferring P rats. *Simple effect of neural sucrose sensitivity on ethanol activity (P < 0.05). C: mean ± SE responses to ethanol by S1 neurons in W and P rats. D: mean ± SE responses to ethanol by S0 neurons in W and P rats. #Response to ethanol by S0 neurons in P rats that is greater than activity to each lower ethanol concentration measured in this line (P < 0.05).

