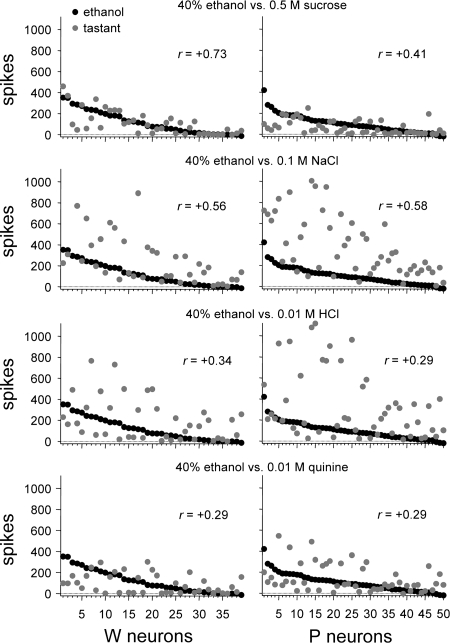
Fig. 5.
Across-unit responses to each prototype stimulus (group I, Table 1) relative to activity to 40% ethanol for neurons recorded from W (left) and alcohol-preferring P (right) rats. Neurons are rank-ordered along the x-axis by their response to 40% ethanol. The Pearson coefficient of correlation (r) calculated between the across-neuron response pattern to 40% ethanol and each stimulus is given.

