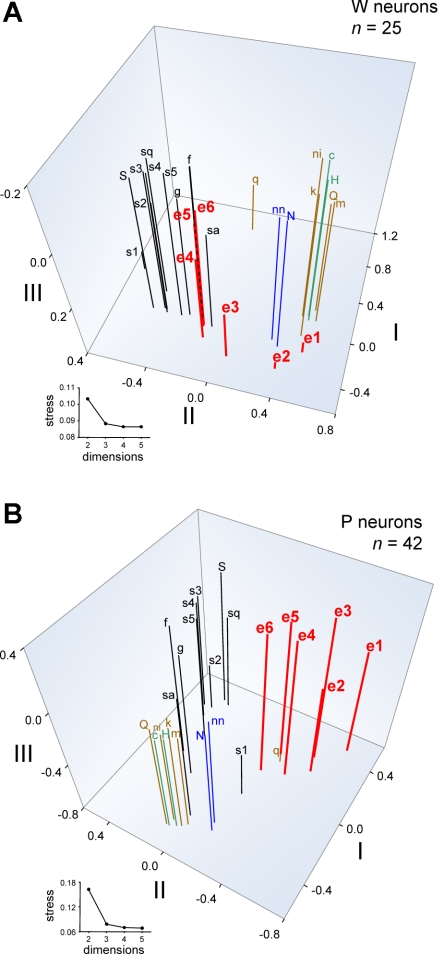
Fig. 6.
Three-dimensional spaces showing the outcome of metric MDS analyses of across-unit responses to all taste stimuli and all concentrations of ethanol by neurons recorded from W (A) and ethanol-preferring P (B) rats. An abbreviation (Table 1) marks the position of each stimulus response in the scaling spaces. The number of neurons in each analysis is indicated. Insets: stress functions for 2- to 5-dimensional solutions. Stress, an index of the badness of fit of the scaling solution to the data, is dramatically reduced with 3-dimensional MDS but is not further appreciably reduced with 4- or 5-dimensional analyses. Thus 3-dimensional MDS was used. Axes represent arbitrary units. Stimuli are color coded according to their general taste category: black, sweet; red, ethanol; blue, sodium salt; green, acid; brown, bitter or aversive.

