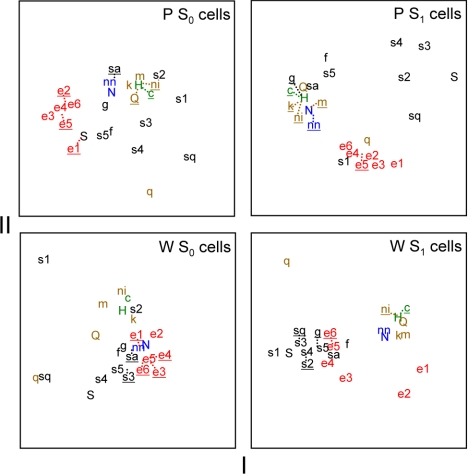
Fig. 7.
Plots showing the outcome of metric MDS applied to taste responses by neurons showing either low (S0 cells) or high (S1 cells) sensitivity to sucrose in W and P rats. Each plot shows the first 2 dimensions of solutions resulting from 3-dimensional MDS to reduce complexity. All plots are scaled identically along the x- and y-axes. An abbreviation (Table 1) marks the position of each stimulus response in the scaling spaces. Dotted lines are used to offset overlapping abbreviations (underlined) from their actual position to improve clarity. Stimuli are color coded as in Fig. 6.

