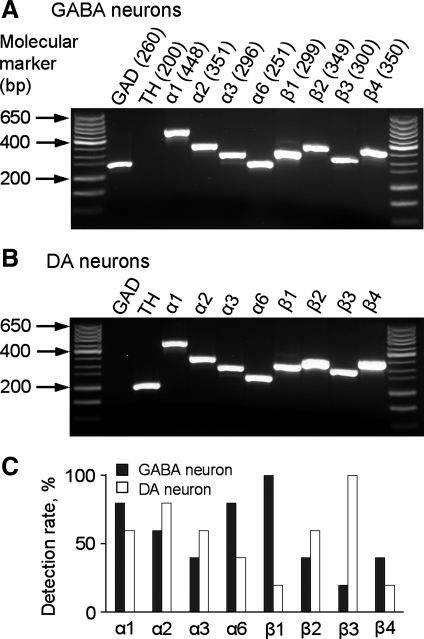
Fig. 2.
Single-cell RT-PCR scRT-PCR detection of Nav mRNAs in SNr GABA neurons and nigral DA neurons. A: voltage-activated sodium (NaV) mRNAs detected in electrophysiologically identified SNr GABA neurons. No tyrosine hydroxylase (TH) mRNA was detected in any of these neurons. Numbers in the parentheses are the expected amplicon sizes in base pair. B: NaV mRNAs detected in electrophysiologically identified nigral DA neurons. The expected amplicon sizes are the same as in A. C: summary of scRT-PCR detection ratio of Nav channel mRNAs in SNr GABA neurons and nigral DA neurons. For each NaV mRNA, 5–10 TH mRNA-positive DA neurons and 5–10 glutamate decarboxylase 1 (GAD1) mRNA-positive neurons were tested. In this figure and Fig. 3, the NaV α-subunits are denoted as α1, α2, α3, and α6, while the standard nomenclature (NaV1.1, NaV1.2, NaV1.3, and NaV1.6) is used in the main text (Catterall et al. 2005).

