Fig. 9.
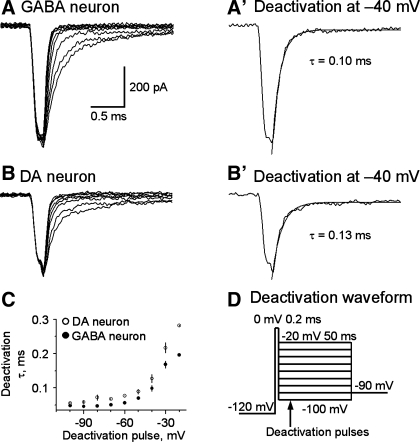
INaT deactivation is faster in SNr GABA neurons than in SNc DA neurons. A and B: representative traces of INaT deactivation in nucleated membrane patches from a SNr GABA neurons (A) and a SNc DA neuron (B). The two traces at −40 mV are displayed in A′ and B′ to show more clearly INaT deactivation at −40 mV. The smooth gray curves are single-exponential fits. C: pooled data for deactivation time constants plotted against deactivation potentials. Filled circle: SNr GABA neurons. Open circles: SNc DA neurons. The time constants were shorter at −80 to −20 mV, P < 0.05. D: voltage waveform used to evoke INaT deactivation. Holding potential, −90 mV; 50-ms pulse to −120 mV; 200-μs pulse to 0 mV; 50-ms test pulse from −100 mV to −20 mV at 10-mV increase.

