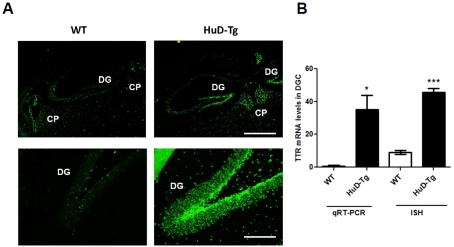
Figure 2. Increased TTR mRNA levels in DGCs of HuD-Tg mice.
(A) TTR FISH images from WT and HuD-Tg mice. Low magnification taken using a ×4 objective show expression of TTR mRNA in CP in WT and HuD-Tg mice and in the dentate gyrus of HuD-Tg mice. Scale bar = 750 μm. High magnification (×20) images show increase TTR mRNA in DGC of HuD Tg mice. Scale bar = 150 μm. (B) Quantification of TTR mRNA levels in DGCs of WT and HuD-Tg by ISH and qRT–PCR was performed as described in the Materials and methods section. *P<0.05 and ***P<0.001.

