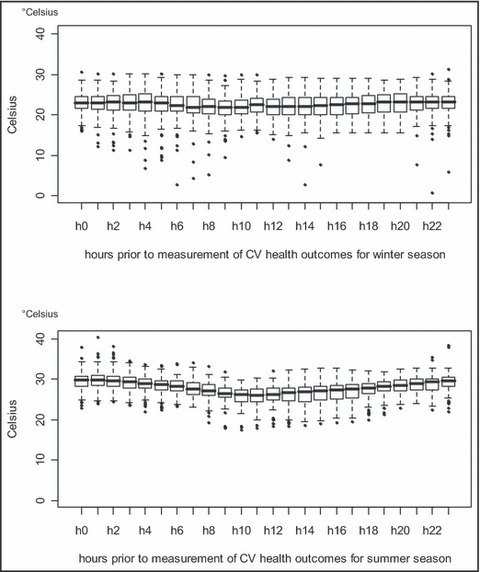
Figure 2.

Twenty four–hour personal‐level environmental temperature (PET) values. Graph of the PET levels for the 24‐hour period preceding the cardiovascular (CV) outcome measurements. Lines and boxes represent the median and interquartile ranges, respectively. Graphed confidence intervals are set at 95% with individual outliers presented as data points. h indicates hour.
