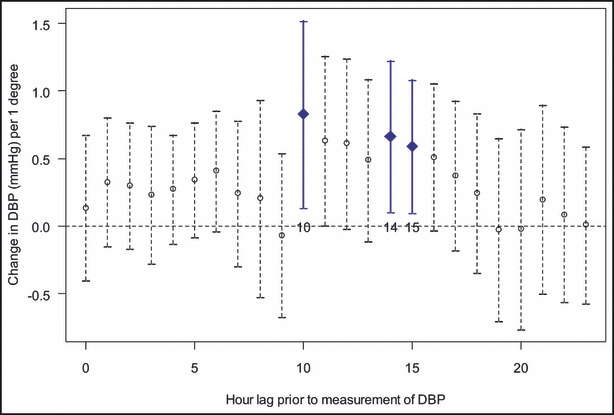
Figure 4.

Associations between hourly personal‐level environmental temperature (PET) values and diastolic blood pressure (BP). The associations between diastolic BP and each hourly (h) PET value measured during the preceding 24 hours. Points indicate linear PET‐BP associations (coefficient β1, change in BP per 1°C) and vertical line segments are the 95% confidence intervals for each hourly time point from the full (multivariate) linear mixed model (1). Statistically significant time points are bolded in square shape for P<.01 and in diamond shape for P<.05.
