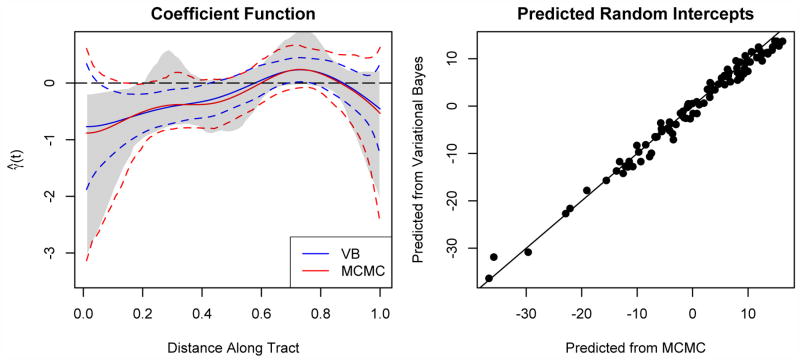
Fig 4.
Results of fitting model (2.8) to the diffusion tensor imaging dataset. The left panel shows the estimated coefficient function; credible intervals for both methods are shown in dashed lines, and the nonparametrically bootstrapped interval shown in grey; the right panel shows the random intercepts predicted by both variational Bayes and MCMC sampling.

