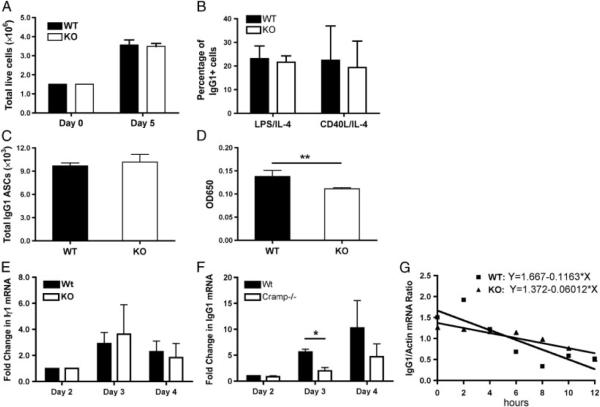
Figure 4.
Camp-deficient B cells produce less IgG1 per cell, with no effect on proliferation, survival, or isotype switching. (A) Resting CD43− WT and Camp−/− (KO) B cells were sort-purified and total live CD40L/IL-4-activated B cells were enumerated on days 0 and 5. (B) The percentage of surface IgG1+ B cells in LPS/IL-4- and CD40L/IL-4-activated cultures was determined using flow cytometry. (C) The number of IgG1-secreting B cells was determined using ELISpot analysis on CD40L/IL-4-activated cells. (D) The IgG1 spots developed from the ELISpot procedure were dissolved using DMSO and the optical density was determined at 650 nm. (E and F) RT-PCR analysis was performed on days 2–4 after activation for the level of (E) Iγ1 and (F) IgG1 mRNA. (G) Actinomycin D was added to day 5 WT and Camp−/− B-cell cultures and total RNA was collected every 2 h for 12 h. RT-PCR was performed for the level of IgG1 mRNA at each time point and regression analysis was applied to estimate the stability of the mRNA transcript. Data represent the mean1SEM from three independent experiments. Data were analyzed by a two-tailed unpaired t test. *p<0.05, **p<0.01.

