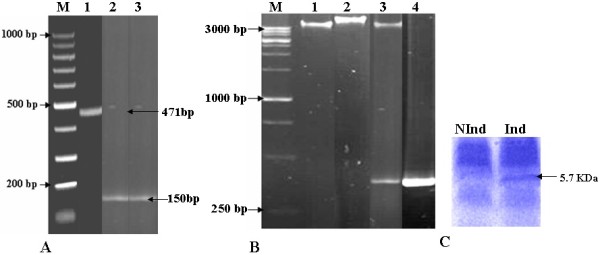
Figure 2.

Gel electrophoresis showing: Panel A: positive PCR representing full length and mature peptide (471 and 150 bp, respectively), Panel B: clone PCR-SpliDef after insert release with EcoRI, and PCR confirmation. Lanes 1, 2, 3 and 4 show empty PCR-TOPO, E. coli harbouring PCR-SpliDef, PCR-SpliDef after digestion with EcoRI and positive control (471 bp amplified cDNA segment from SpliDef), respectively. PCR mix without DNA was used as negative control. Lanes M: DNA Markers. The size of the bands is shown in bp. Panel C: 12% Tricine SDS-PAGE showing the expressed protein after induction with IPTG.
