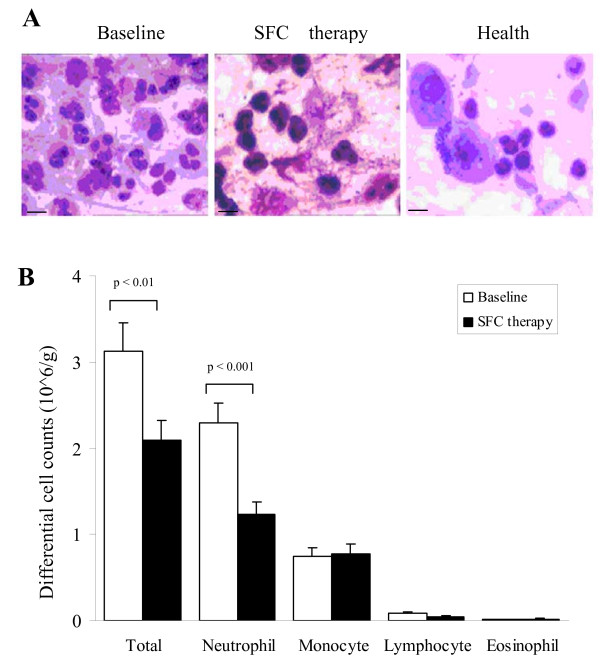
Figure 2.
Total cell number and neutrophils decreased in induced sputum of COPD patients after SFC therapy. (A) Photomicrograph of Giemsa staining on sputum cells of COPD patients in Baseline (left) and SFC therapy (middle), or healthy controls (right). 20 μM. (B) Histogram shows the numbers of total and the inflammatory cells, including neutrophils, monocytes, lymphocytes and eosinophils in the induced sputum of COPD patients. p < 0.01, p < 0.001, compared with SFC therapy.

