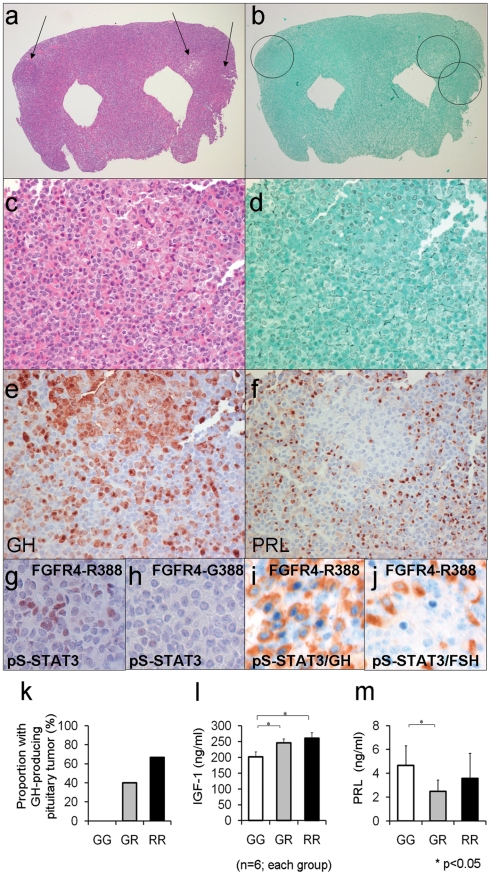
Figure 5. Mouse knock-in of the FGFR4 SNP facilitates pituitary GH cell tumorigenesis.
(a) The pituitary glands of Fgfr4-R385 knock-in mice reveals multiple adenomas (arrows) (H&E stain; magnification ×10). (b) The Gordon Sweet silver stain confirms loss of acinar structures (magnification, ×15). (c) The polygonal tumor cells form cords and nests (H&E stain; magnification ×150). (d) The reticulin stain shows the nodules exhibit total breakdown of the reticulin fiber network, diagnostic of adenoma (Gordon Sweet silver stain; magnification, ×150). (e) GH immunoreactivity is identified in somaototroph cells and strongly in adenoma cells (Avidin-biotin-peroxidase complex technique; magnification, ×200). (f) In the pituitary of the knock-in mouse, PRL immunoreactivity is identified in mammosomatotroph cells but not in adenoma cells (Avidin-biotin-peroxidase complex technique; magnification, ×200). (g) Phospho-serine (pS727-STAT3) immunoreactivity is identified in pituitary cells of Fgfr4-R385(+/+) mice but not (h) FGFR4-G385 (wild type) mice. (i) pS727-STAT3 immunoreactivity is co-localized in GH-expressing cells of Fgfr4-R385(+/+) mice, but not (j) gonadotroph cells of the same animals. (k) The frequency of pituitary tumor development in mice for Fgfr4-385 (G/G), heterozygote (G/R), or homozygote (R/R) is shown. (l) Circulating IGF-1 levels as an integrated measure of pituitary GH output or prolactin (PRL) (m) were compared in mice of the corresponding FGFR4 genetic background. Shown are the mean ±SEM of 6 mice in each group where statistically significant differences (p<0.05) were noted.

