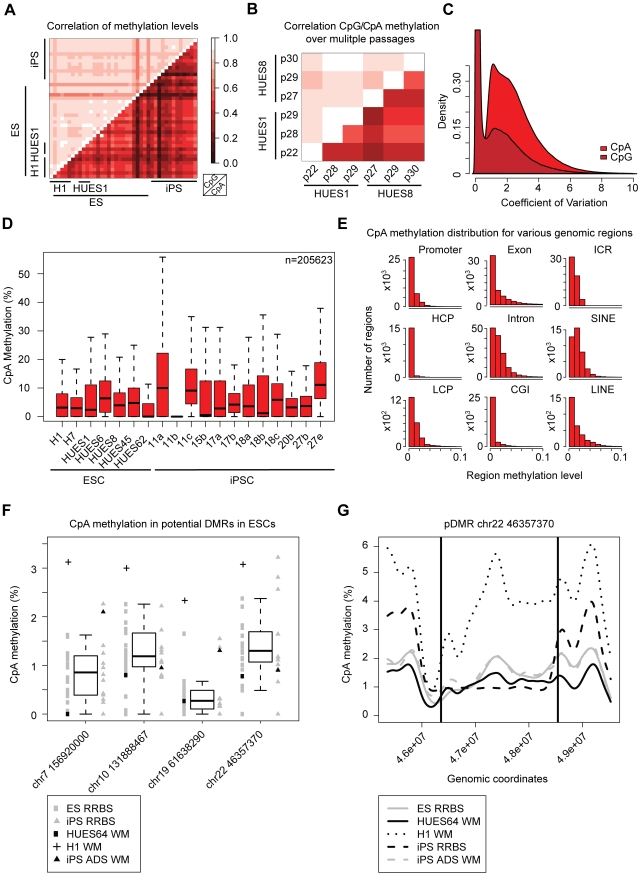
Figure 2. CpA methylation shows little conservation over several passages.
(A) Heatmap of pearson correlation coefficients for CpG (upper triangle) and CpA (lower triangle) methylation patterns in all pairs of pluripotent cell lines. Selected lines are highlighted. (B) Heatmap showing the pearson correlation coefficients for CpG (upper triangle) and CpA (lower triangle) methylation levels in pairs of pluripotent cell lines assessed at consecutive passages. (C) Distribution of the coefficient of variation over all individual CpG and CpA methylation levels across all ESC samples (n = 30). (D) Boxplot of CpA methylation levels in 7 ESC and 12 iPSC lines. Boxplots are based on 205623 CpAs that show more than 0.1% of median methylation in the selected ESC lines (n = 7). Boxes are 25th and 75th quartiles, whiskers indicate most extreme data point less than 1.5 interquartile range from box and black bar represents the median. (E) Distribution of CpA methylation levels in different genomic region classes averaged over a representative set of pluripotent cell lines at different passages (n = 12: H1, HUES1, HUES3, HUES6, HUES8, HUES45, H9, iPS 15b). HCPs are defined as promoters overlapping with a CG island, LCPs are promoters without a CG island. For a detailed definition of the regions see Materials and Methods. (F) Boxplot of CpA methylation levels across four genomic regions over all distinct ESC lines (n = 20) assessed by RRBS. These regions were reported to be consistently hypomethylated between five iPSC and two ESC lines [11]. In addition methylation levels from previously published whole genome bisulfite sequencing (WM) for H1 [9], iPSC ADS [11] as well as our HUES64 WM are shown. Boxes are 25th and 75th quartiles, whiskers indicate most extreme data point less than 1.5 interquartile range from box and black bar represents the median. (G) CpA methylation profile of one selected DMR (framed by black lines) on chromosome 22 based on a 1 kb tiling. The CpA methylation levels based on RRBS are shown for the median of all ESCs (n = 20) and all iPSCs (n = 12) as well as WM levels for H1p25, iPS ADS and HUES64.

