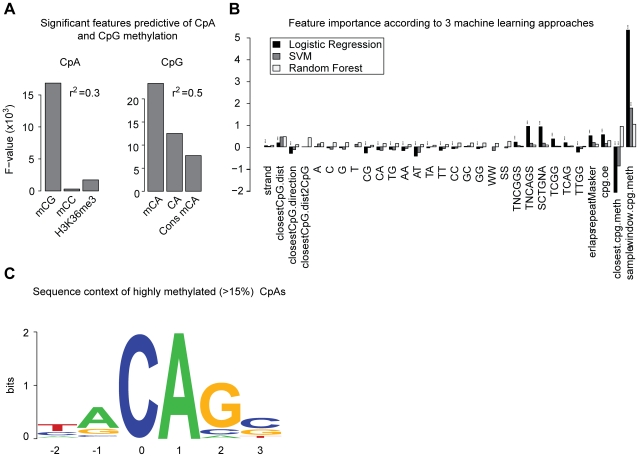
Figure 5. Genomic context and attributes of CpA methylation.
(A) Significant and most influential features predictive for CpA methylation in a linear model based on a 1 kb tiling of the human genome covered by RRBS (n = 32300 tiles). The linear model included classical sequence features (but excluding CpG density) as well as methylation of CpG, CpT, CpC, H3K36me3 methylation and conservation of CpA methylation state. F-statistics reported for 9 and 32291 degrees of freedom. (B) Feature importance for prediction of CpA methylation according to three machine learning approaches. Depicted are logistic regression and linear SVM weights (black and dark grey, respectively) as well as feature Mean Decrease in Gini Index (MDG, light grey) according to random forests (rescaled such that the largest MDG corresponds to 1). Significant features characterized by a p-value <0.05 for logistic regression or a z-score >1.96 for linear SVM are marked (***). A detailed description of features is given in Table S2. (C) Sequence context of consistently highly methylated (mean ≥15%) CpAs (n = 5551) over all ES cell lines n = 30.

