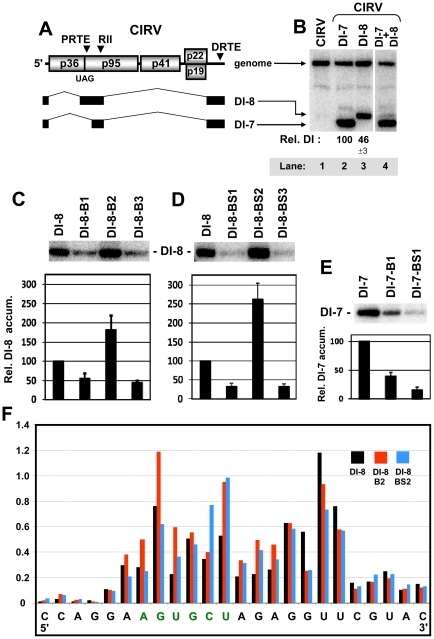
Figure 6. Assessing the role of the PRTE and DRTE in modulating viral RNA replication.
(A) Schematic linear representation of the CIRV RNA genome and CIRV-derived DI-8 and DI-7 RNA replicons. The relative locations of the PRTE, RII, and DRTE are indicated above the genome. DI-8 and DI-7 are represented as a series of black boxes and thin intervening lines. The black boxes represent corresponding regions of the CIRV genome that are retained in the DI RNAs and thin lines represent regions that are absent. (B) Northern blot analysis and quantification of DI RNA accumulation when cotransfected with wt CIRV into plant protoplasts. DI-7 and DI-8 RNAs were analyzed 22 hr post-transfection and relative values below the lanes correspond to means (± standard error) from three independent experiments. (C and D) Northern blot analysis of DI-8 RNA accumulation when cotransfected with wt CIRV into plant protoplasts. Mutants DI-8-B1,-B2, -B3, -BS1, -BS2 and -BS3 contain the same substitutions as in genomic mutants B1, B2, B3, BS1, BS2, and BS3, respectively, as shown in Figure 2A. DI-8 RNAs were analyzed by Northern blot as described above. (E) Northern blot analysis of DI-7 RNA accumulation when cotransfected with wt CIRV in plant protoplasts. Mutants DI-7-B1, and -B2 contain the same substitutions as in genomic mutants B1 and B2, respectively, as shown in Figure 2A. (F) SHAPE analysis of the PRTE and its flanking sequence in wt DI-8 and mutant DI-8-B2 and DI-8-BS2. Relative reactivity of each nucleotide is plotted graphically, with larger values corresponding to increased flexibility. The PRTE is shown in green.

