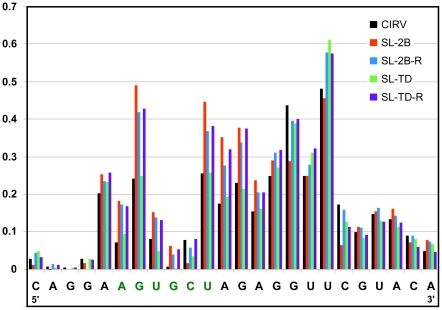
Figure 8. SHAPE analysis of the PRTE in viral genomes containing substitutions in RIV.
Relative reactivity of each nucleotide is plotted graphically, with larger values corresponding to increased flexibility. The genomic mutants assayed are indicated in the key at the top right and correspond to those described in Figure 7B.

